Trade Indices CFDs
Trade indices from the US, UK, Europe, Asia and Australia
Trading is risky
INDICES FROM
US, UK, EU & ASIA
TRADE FROM
$0 COMMISSION
UP TO
1: 100 LEVERAGE
+
16 INDICES
INDICES FROM
US, UK, EU & ASIA
TRADE FROM
$0 COMMISSION
UP TO
1: 100 LEVERAGE
+
16 INDICES
Trade global stock market indices
Symbol
Bid
Ask
Spread

*The prices on this page are indicative. Prices for instruments with lower liquidity such as but not limited to exotic currency pairs, stocks and indices are not refreshed as often as commonly traded instruments. Please check inside your MT4/MT5 platform for latest live prices
What are indices?
Indices represent a collection of stocks organised by industry sector or country with their aggregate performance being tracked. Indices are particularly useful for monitoring the broader stock market's general performance. As well as providing a singular tradable instrument for gaining exposure in all the indices constituent stocks.

Popular indices include
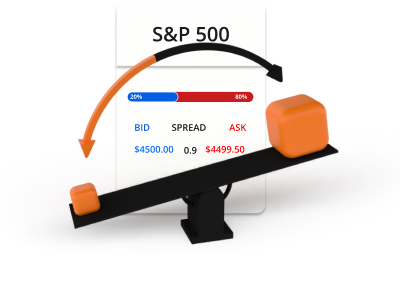
S&P 500
Symbol: S&P500
An index composed of 500 large US companies, representing the overall US stock market.
Dow Jones
Symbol: DJ
An index that tracks 30 large publicly-owned U.S. companies.
Nasdaq
Symbol: NAS
An index that includes all the stocks listed on the NASDAQ stock exchange. The Nasdaq is heavily influenced by the technology sector.
FTSE 100
Symbol: UK100
An index representing the 100 largest companies listed on the London stock exchange in the UK.
DAX
Symbol: DE30
An index of the major German companies listed on the Frankfurt Stock Exchange.
Euro Stoxx 50
Symbol: STOXX50
An index of Europe's leading blue-chip companies from 12 Eurozone member states.
IBEX 35
Symbol: ESP35
A Spanish stock market index comprising 35 of the most liquid stocks traded on the Madrid stock exchange.
ASX 200
Symbol: AUS200
A benchmark index of the top 200 companies listed on the Australian securities exchange.
Nikkei 225
Symbol: JP225
A stock market index representing 225 large Japanese companies listed on the Tokyo stock exchange.
Hang Seng Index
Symbol: HK50
An index representing 50 largest and most liquid companies listed on the Hong Kong stock exchange.
How Indices trading works
Indices trading allows you to trade on the performance of a group of stocks without needing to buy shares in each individual company. If you think the value of the index is likely to rise, you can simply buy the index. If you think the value of the index is likely to fall, you can sell it.
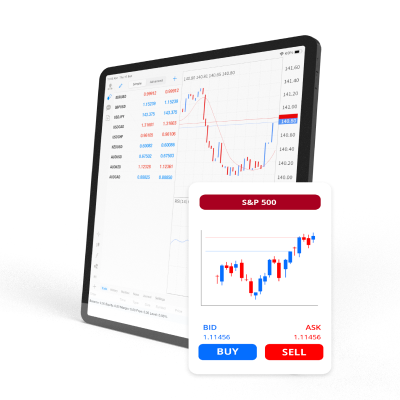
Bid and ask prices
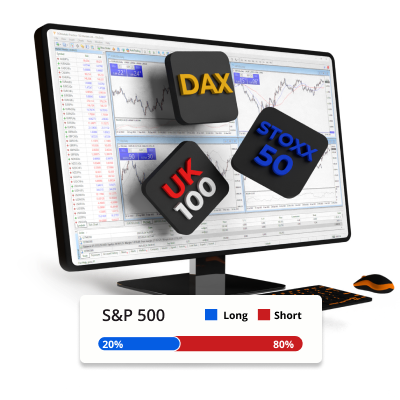
Go long or short

Indices are traded in lots
Indices trading involves leverage and margin
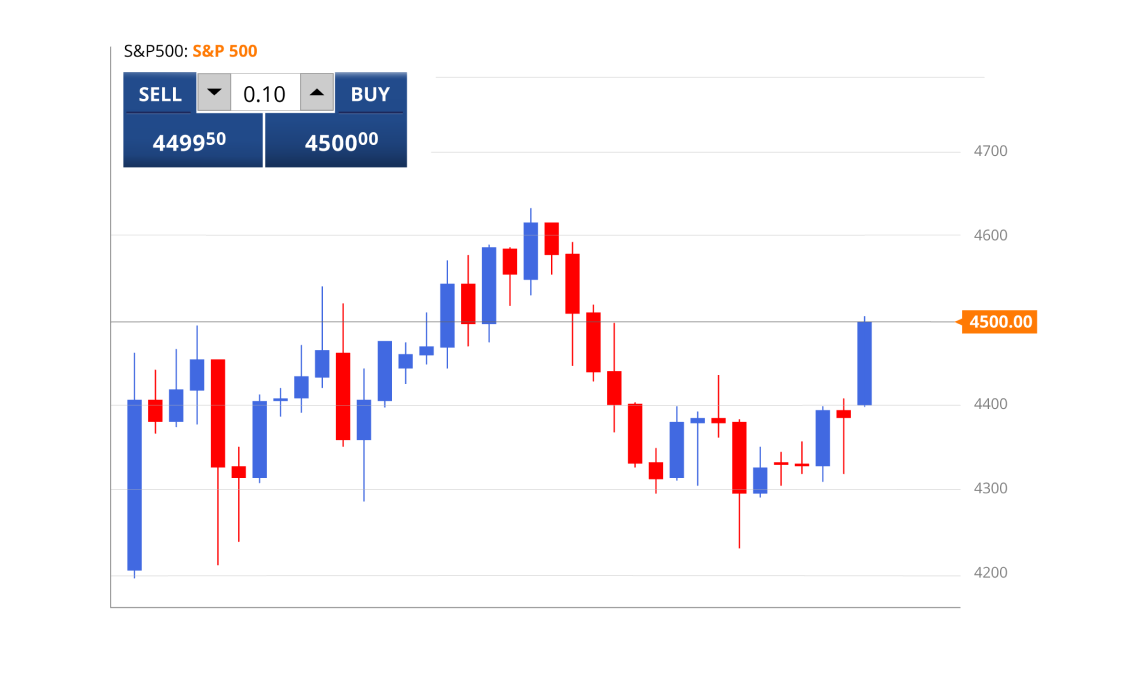
Indices trading example
You decide to buy 0.1 lots of the S&P500 at 4500 using 100:1 leverage.
10 indices contracts x 4500 = USD 45,000
USD 45,000
USD 45,000 / 100 = USD 450
Now you have opened a long position in the S&P500 worth USD 45,000. Since indices are traded using leverage, only $450 was used as margin from your trading account. After some time, the price of the S&P500 moves and you decide to sell.
Scenario 1
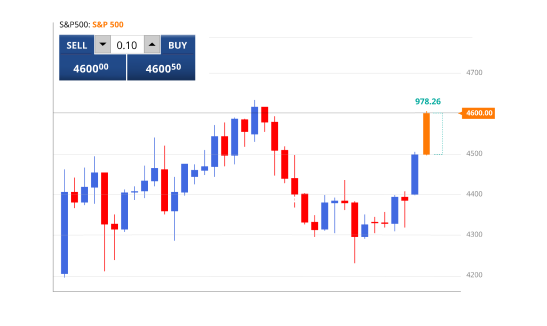
The S&P500 moves up from 4500 to 4600 and you decide to sell.
This is how the profit or loss on the trade would be calculated.
P/L = (Current price - Initial price) x Position value) / Current price
P/L= ((4600 - 4500) x 45,000) / 4,600
P/L = (100 x 45,000) / 4,600
P/L = 978.26
Scenario 2
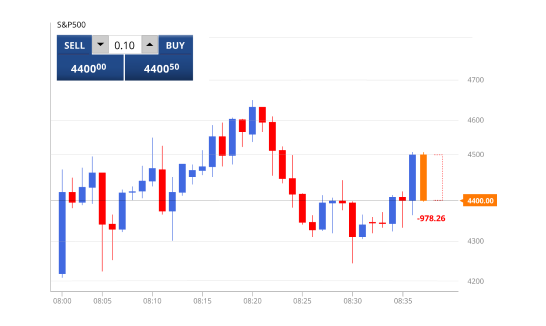
The S&P500 moves down from 4500 to 4400 and you decide to sell.
This is how the profit or loss on the trade would be calculated.
P/L = (Current price - Initial price) x Position value) / Current price
P/L = ((4400 - 4500) x 45,000) / 4,400
P/L = (-100 x 45,000) / 4,600
P/L = -978.26
Why TIOmarkets
This is why people like you choose TIOmarkets

Spreads from 0.0 pips
Trade with raw variable spreads on our Raw account

Commission-free trading
Trade from $0 per lot on our VIP Black or Standard trading accounts

MT4 & MT5
Advanced trading platforms for desktop, web and mobile

Fast order execution
Efficient and reliable order processing in milliseconds

Unlimited leverage
Trade with up to unlimited leverage on our Standard account

30% Loyalty bonus
Get a bonus on every deposit to our Standard account
Trade on the MT4 trading platform
From your desktop, internet browser or mobile

MT4 was designed and developed for forex and futures trading. To enable traders to analyze and trade financial markets, back test trading strategies, develop trading robots and copy other traders.
Available for:


Start trading in minutes
This is how it works

STEP 1
Register
Complete your profile and create your account, it only takes a few minutes

STEP 2
Verify
Upload your proof of identity and address, this is required before withdrawal
STEP 3
Fund
Choose from convenient local and international methods and deposit instantly
STEP 4
Trade
Download the platform, transfer funds to your account, log in and start trading
Trading is risky