The Gartley Pattern | Identify price reversals with harmonic patterns
BY Janne Muta
|april 3, 2024The Gartley pattern provides traders with a systematic approach to market predictions and trading opportunities. This pattern, conceptualized by H.M. Gartley in his 1935 masterpiece "Profits in the Stock Market," has since become a fundamental tool in the technical analyst's arsenal. Its significance lies not just in its historical context but in its applicability across various financial markets, offering insights into potential price movements.
The Gartley pattern, often referred to by its moniker “222” (Gartley 222 Pattern) due to its original page number in Gartley's book, is distinguished by its unique XABCD structure. This structure incorporates Fibonacci retracement levels to predict potential reversals in market trends. The pattern is known for its ability to identify significant price points and the market turns, thereby addressing two of the trader's most critical questions: when to buy or sell.
This pattern’s genesis in the mid-1930s marks a pivotal moment in trading history, introducing a methodical and statistical approach to market analysis. Gartley's work laid the groundwork for future developments in trading strategies and tools, inspiring a plethora of books, software, and derivative patterns that expand upon the original Gartley 222 pattern's principles.
What is the Gartley pattern?
The Gartley pattern is a sophisticated framework within harmonic chart patterns. It is identified through a distinctive XABCD structure that highlights potential reversal points in the market. This structure is pivotal in differentiating the pattern from other chart patterns, requiring a keen understanding of its components and the Fibonacci retracement levels that define its formation. The identification process is both an art and a science, necessitating a meticulous examination of price movements and Fibonacci levels.
How to identify a Gartley pattern
If you are patient and willing to wait for the pattern to appear in the market you trade, and also prepared to meticulously study the charts then here’s how identification of the pattern works.
The identification process begins with pinpointing the initial leg, marked as XA. This leg represents a significant price movement, either bullish or bearish. Following this, the pattern unfolds through a series of price retracements and extensions, each correlating with specific Fibonacci ratios that define the subsequent legs - AB, BC, and CD.
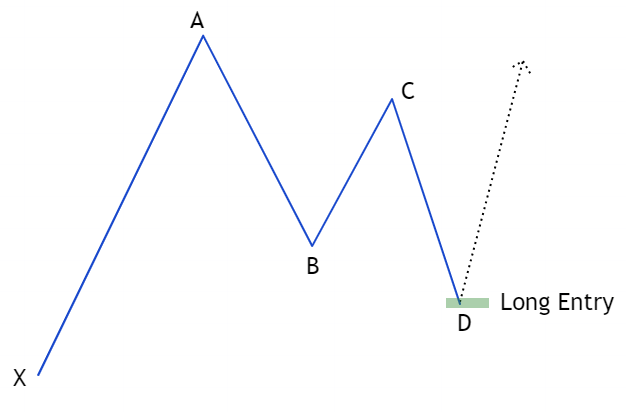
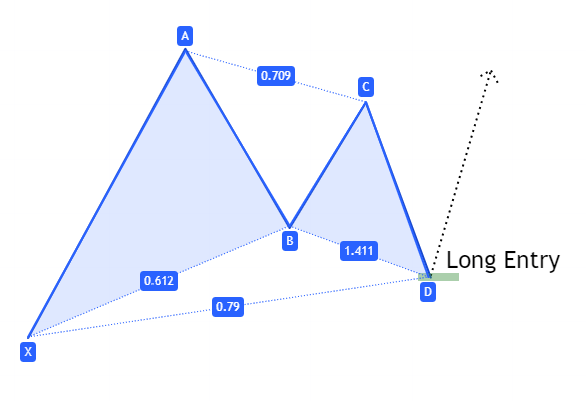
The Bullish Gartley Pattern
Leg XA: The starting point, XA, is a significant move on the chart. This move sets the stage for the pattern's development.
Leg AB: The AB leg sees a retracement of approximately 61.8% of the XA leg. This precise measurement is crucial for the pattern's validity.
Leg BC: The BC leg is then expected to retrace between 38.2% and 88.6% of AB. This wide range allows for some flexibility in pattern formation.
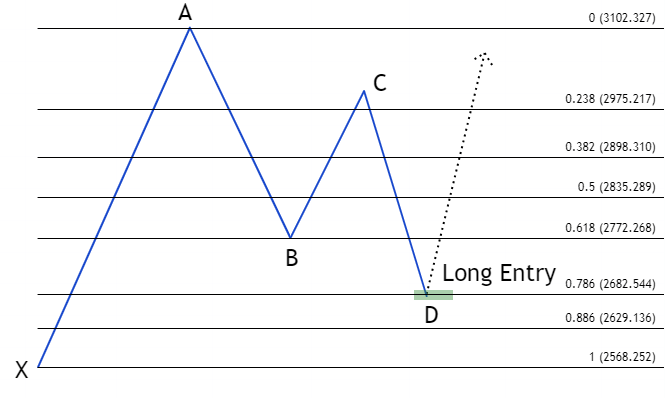
Leg CD: Finally, the CD leg extends beyond the BC leg, typically reaching 78.6% of the XA leg's distance. This final leg is critical as it indicates the potential reversal zone and completes the pattern.
To aid in the visual identification of the Gartley pattern, traders often employ diagrams and charting tools that highlight these specific Fibonacci retracements. The pattern typically resembles an “M” or “W” shape, depending on whether it's a bullish or bearish setup, respectively. The key is to observe the convergence of these Fibonacci levels, which signals a high probability of price reversal.
Understanding the sequence of the pattern is essential for accurate identification. Each leg within the pattern must adhere to its prescribed Fibonacci ratios for the pattern to be valid. It's this precision and the interrelation between the segments that forecast potential market movements with a higher degree of reliability.
Bullish Gartley: A bullish pattern forms during a downtrend, signalling potential upward reversals where traders might consider buying.
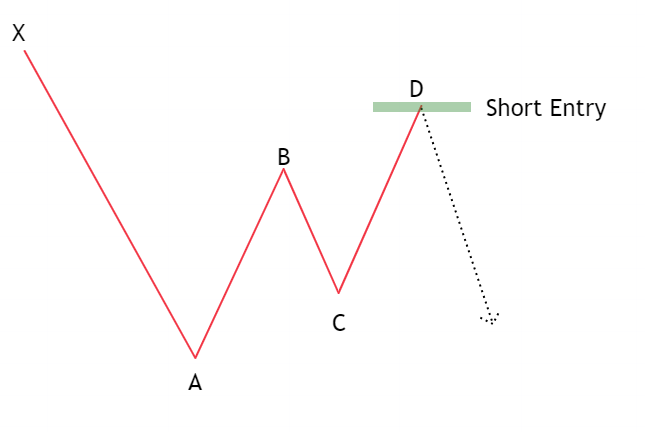
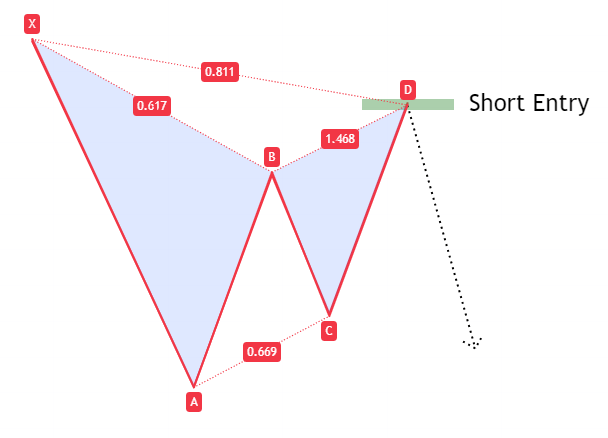
Bearish Gartley: Conversely, a bearish Gartley pattern appears during an uptrend, indicating possible downward reversals, prompting selling decisions.
Gartley Pattern Trading Strategies
Trading strategies employing this pattern focus on capitalising on the potential reversals it predicts. These strategies revolve around identifying optimal entry and exit points, which obviously help in maximising returns and minimising risks. The pattern's utility in both bullish and bearish market scenarios provides a useful tool for traders.
Bullish Gartley Strategies
When a bullish Gartley pattern is identified, it suggests that the current downtrend is nearing its end and a reversal to an uptrend is imminent. Traders look for the completion of the D point as a signal to enter a long position.
- Entry Point: The ideal entry point is at or near the completion of the D leg, where the pattern suggests the price will start increasing. Traders may wait for additional confirmation, such as a bullish candlestick pattern, before entering a trade.
- Stop-Loss: To manage risk, a stop-loss order is typically placed below the lowest point of the D leg. This positioning protects against the possibility that the predicted reversal does not materialise.
- Take-Profit: Profit targets are often set using Fibonacci extension levels or by identifying previous resistance levels. A common approach is to set a take-profit at a significant Fibonacci level above the D point, such as the 0.618 or 0.786 retracement of the CD leg.
Bearish Gartley Strategies
In contrast, a bearish Gartley pattern indicates that an ongoing uptrend is expected to reverse into a downtrend. This scenario presents an opportunity to enter a short position.
Entry Point: Traders look to enter a short position at the completion of the D leg, where the pattern forecasts a decline in prices. Similar to bullish setups, confirmation from other indicators or candlestick patterns can enhance decision-making.
Stop-Loss: A stop-loss for a bearish pattern is placed above the highest point of the D leg to mitigate risk if the expected downtrend does not occur.
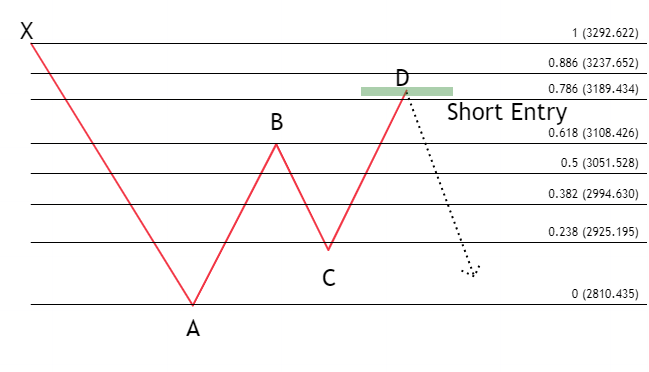
Take-Profit: Profit targets for bearish setups may involve Fibonacci extension levels below the D point or identified support levels. Setting a take-profit at a key Fibonacci level below the D point helps with a strategic exit from the position.
Practical Application of the Gartley Pattern
While the pattern provides valuable insights, it's paramount for traders to consider other technical indicators and market conditions as part of their strategy. Some suggest that by combining the Gartley pattern with indicators like RSI, MACD, or moving averages traders could have additional confirmation and enhance trade decision-making. However, in reality, this adds multiple parameters into the equation and probably just complicates decision-making.
Additionally, considering overall market trends and news that may impact price movements is crucial. The Gartley pattern, like all trading strategies, carries risk, and no prediction is foolproof. Hence, employing sound risk management practices, such as proper position sizing and the use of stop-loss orders, is essential.
Bullish Example
To illustrate the practical application of the Gartley pattern, let's delve into hypothetical scenarios that demonstrate how traders might leverage this pattern in real trading situations. These examples will showcase the identification process, strategic decisions made based on the pattern, and the outcomes of those decisions.
In this hypothetical scenario, a trader identifies a bullish Gartley pattern on the EURUSD daily chart.
The trader, recognising the completion of the D point near the 78.6% Fibonacci retracement level of the XA leg, anticipates a bullish reversal. They enter a long position either by using a market order or by placing a buy limit order at a key support level. Alternatively, a buy-stop order can be used to enter the market on a breakout in the lower time frame charts. A stop-loss order can be placed either below the D point or below point X to limit potential losses.
Bearish Example
Imagine a trader spots a bearish Gartley pattern on the daily chart of a technology stock. The stock had been in a steady downtrend when the formation started to take shape. The trader waits for it to complete. Recognising the completion of the D point near the 78.6% Fibonacci retracement level of the XA leg, the trader anticipates the downtrend could be ready to continue. He shorts the market either by using a market order or by placing a limit sell order at a key support level. Alternatively, a sell-stop order can be used to enter the market on a bearish breakout in the lower time frame charts. A stop-loss order can be placed either below the D point or below point X to limit potential losses.
Risk Management
Effective risk management begins with proper position sizing. Traders should calculate the size of their trades based on the amount of capital they are willing to risk, typically a small percentage of their total trading account. This approach helps in managing losses when trades do not move as anticipated.
Stop-loss orders are indispensable in this strategy as placing stop-loss orders beyond the pattern's reversal points can protect traders from market volatility and limit potential losses. Additionally, traders should adjust their stop-loss levels as the trade moves in their favour to lock in profits and further minimise risk.
Moreover, diversification across different instruments and not relying solely on Gartley formations can reduce risk. By spreading capital across various trading strategies and asset classes, traders can buffer against losses in any single trade.
The key take-aways
The exploration of the Gartley pattern reveals several key takeaways that are indispensable for traders seeking to harness its predictive capabilities within financial markets.
- The Gartley pattern’s foundation on Fibonacci retracement levels underscores the mathematical precision underlying market movements, offering a structured approach to identifying potential reversals.
- The distinction between bullish and bearish Gartley patterns facilitates a dual approach to market analysis, enabling traders to strategize effectively in varying market conditions. This versatility enhances the pattern’s utility across different asset classes, including forex and equities, demonstrating its wide applicability.
- Furthermore, the strategic integration of the Gartley pattern with other technical indicators and sound risk management practices is very important. This combination not only reinforces the reliability of trading signals but also mitigates potential risks.
- The Fibonacci retracements used in finding the formations are guidelines only. Traders often deviate from the exact retracement levels in order to allow more flexibility in their pattern recognition. It is more important to correctly analyse the context you are trading in.
- Lastly, the practical application of the Gartley pattern is a tool for both novice and experienced traders.
Conclusion
In conclusion, the Gartley pattern stands as a testament to the enduring relevance of harmonic trading principles in the ever-evolving financial markets. By meticulously charting the convergence of Fibonacci retracement levels within a unique XABCD structure, the pattern provides traders with a powerful lens through which to anticipate market movements.
We have outlined the pattern’s identification, its structural nuances, and the strategic application in both bullish and bearish scenarios, to show its versatility as a predictive tool.
As trading strategies become increasingly sophisticated, the pattern remains a timeless cornerstone of technical analysis, offering a blend of historical insight and contemporary application. In harnessing the predictive power of the pattern, traders navigate the complexities of the market with greater confidence and precision, embodying the pattern’s legacy as a bridge between past market action and potential trading success.
If you are keen to try trading with the Gartley pattern, start by registering a trading account and downloading the trading platform

Risk disclaimer: CFDs are complex instruments and come with a high risk of losing money rapidly due to leverage. You should consider whether you understand how CFDs work and whether you can afford to take the high risk of losing your money. Never deposit more than you are prepared to lose. Professional client’s losses can exceed their deposit. Please see our risk warning policy and seek independent professional advice if you do not fully understand. This information is not directed or intended for distribution to or use by residents of certain countries/jurisdictions including, but not limited to, USA & OFAC. The Company holds the right to alter the aforementioned list of countries at its own discretion.
TIOmarkets offers an exclusively execution-only service. The views expressed are for information purposes only. None of the content provided constitutes any form of investment advice. The comments are made available purely for educational and marketing purposes and do NOT constitute advice or investment recommendation (and should not be considered as such) and do not in any way constitute an invitation to acquire any financial instrument or product. TIOmarkets and its affiliates and consultants are not liable for any damages that may be caused by individual comments or statements by TIOmarkets analysis and assumes no liability with respect to the completeness and correctness of the content presented. The investor is solely responsible for the risk of his/her investment decisions. The analyses and comments presented do not include any consideration of your personal investment objectives, financial circumstances, or needs. The content has not been prepared in accordance with any legal requirements for financial analysis and must, therefore, be viewed by the reader as marketing information. TIOmarkets prohibits duplication or publication without explicit approval.

Janne Muta holds an M.Sc in finance and has over 20 years experience in analysing and trading the financial markets.
Related Posts


Trade responsibly: CFDs are complex instruments and come with a high risk of losing all your invested capital due to leverage.