Trade Stock CFDs
Go long or short 170+ stocks with low fees
Trading is risky
TRADE FROM
TICK SPREAD
TRADE FROM
COMMISSION
UP TO
20 LEVERAGE
+
STOCKS
TRADE FROM
TICK SPREAD
TRADE FROM
COMMISSION
UP TO
20 LEVERAGE
+
STOCKS
TRADE FROM
TICK SPREAD
TRADE FROM
COMMISSION
UP TO
20 LEVERAGE
+
STOCKS
Trade stocks of major companies
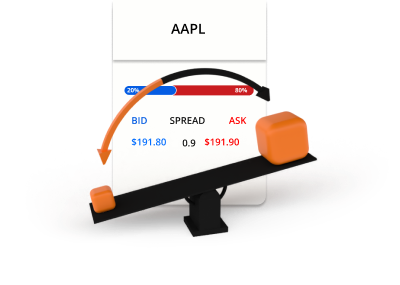
Bid
Ask
Spread
*The prices on this page are indicative. Prices for instruments with lower liquidity such as but not limited to exotic currency pairs, stocks and indices are not refreshed as often as commonly traded instruments. Please check inside your MT4/MT5 platform for latest live prices
What are stocks?
Stocks, also known as shares or equities, represent ownership interest in a company. When you buy a company's stock, you're purchasing a small piece of that company, including the right to a portion of the company's earnings. Stocks are issued by companies to raise capital in order to grow the business and they can be bought and sold. However, with stock CFD trading, it allows you to speculate on the price movement without needing to own the actual stocks.
How stock CFD trading works
Trading in stock CFDs allows you to speculate on the price movements of company stock without owning the actual shares. If you think the share price is likely to rise, you can simply buy it. If you think the price of the shares is likely to fall, you can sell it.
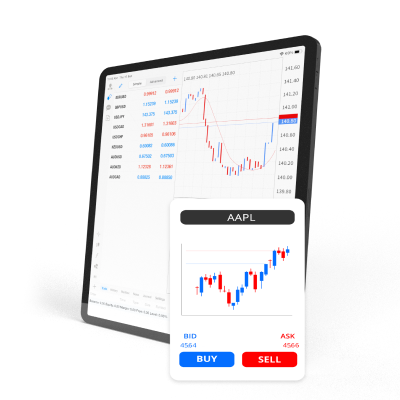
Bid and ask prices
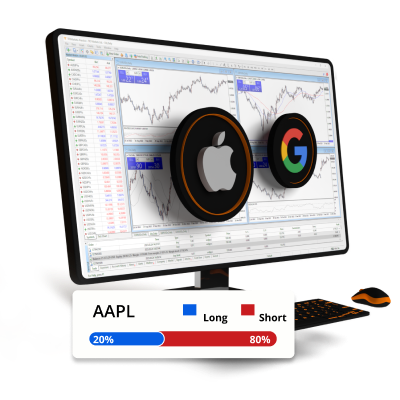
Go long or short

Stocks are traded in lots
Stock trading involves leverage and margin
Stock trading example
You decide to buy 0.1 lots of Apple (AAPL) at $200 using 20:1 leverage.
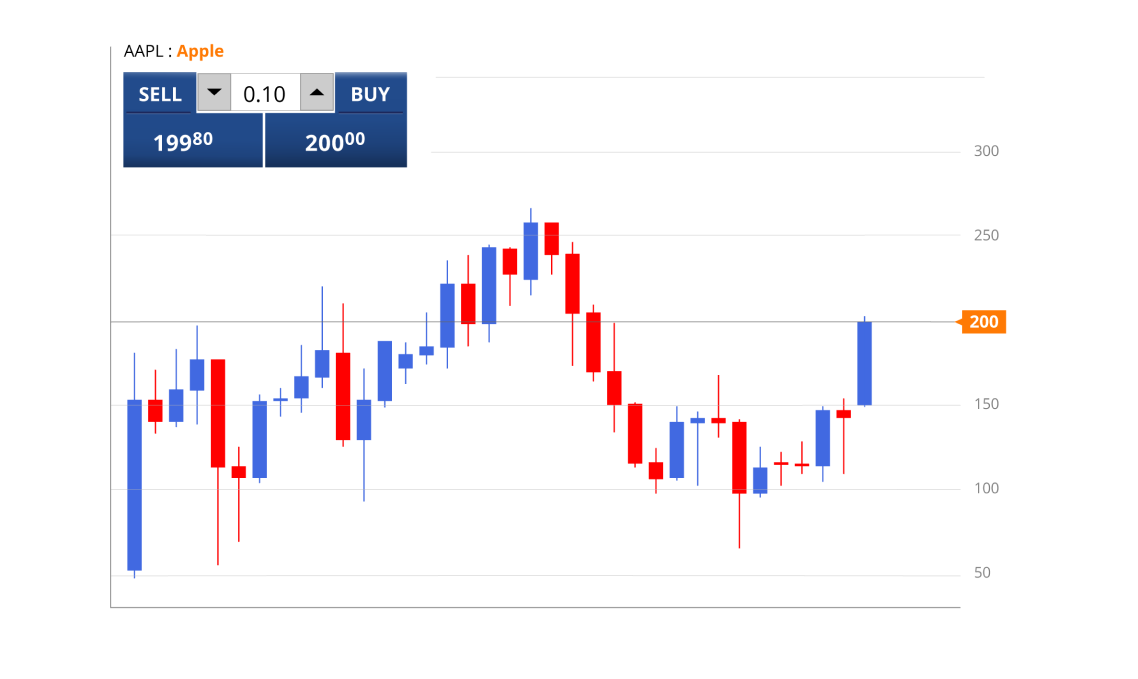
0.1 lots = 10 share CFDs of AAPL
10 share CFDs x $200 = $2,000
$2,000 / 20 = $100
Now you have opened a long position in AAPL worth $2,000. Since stock CFDs are traded using leverage, only $100 was used as margin from your trading account. After some time, the price of AAPL moves and you decide to sell.
Scenario 1
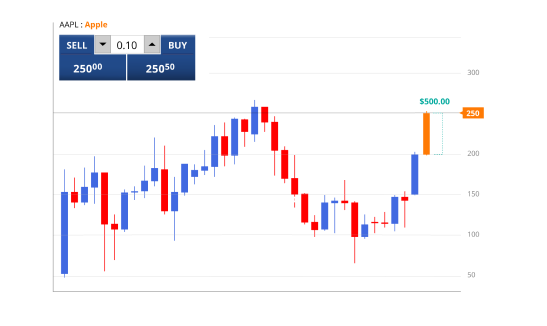
AAPL moves up from $200 to $250 and you decide to sell.
This is how the profit or loss on the trade would be calculated.
P/L = (Current price - Initial price) x Quantity
P/L = ($250 - $200) x 10
P/L = $50 x 10
P/L = $500
Scenario 2
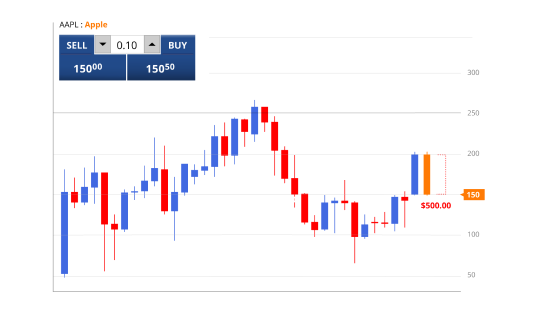
AAPL moves down from $200 to $150 and you decide to sell.
This is how the profit or loss on the trade would be calculated.
P/L = (Current price - Initial price) x Quantity
P/L = ($150 - $200) x 10
P/L = -$50 x 10
P/L = - $500

Great value trading with a premium service
This is why people like you choose TIOmarkets

Spreads from 0.0 pips
Trade with raw variable spreads directly from our liquidity providers

Zero commission
Trade from $0 per lot on our VIP Black or Standard trading accounts

Low starting amount
Open your account from just $20 to start trading

Fast order execution
Trades are executed in milliseconds, with low slippage, most of the time

Unlimited leverage
Maximize your potential by trading with up to unlimited leverage

30% Loyalty bonus
Get a bonus on every deposit to our Standard account
Trade on the MT4 or MT5 trading platforms
From your desktop, internet browser or mobile

Metatrader5
MT5 is a multi-asset trading platform that includes everything you will find in MT4. Plus more capabilities and technical analysis tools than its predecessor. Including more order types and a built-in economic calendar.
Available for:


Getting started is quick and simple
It only takes a few minutes, this is how it works

STEP 1
Register
Complete your profile and create your account

STEP 2
Fund
Deposit instantly with our convenient funding methods

STEP 3
Trade
Download the trading platform and log in to start trading
Trading is risky
Learn more about trading with TIOmarkets


Trade responsibly: CFDs are complex instruments and come with a high risk of losing all your invested capital due to leverage.
These products are not suitable for all investors and you should ensure that you understand the risks involved.