Gold Forecast for the Week of 23rd March 2026
BY TIOmarkets
|March 23, 2026Gold Market Overview
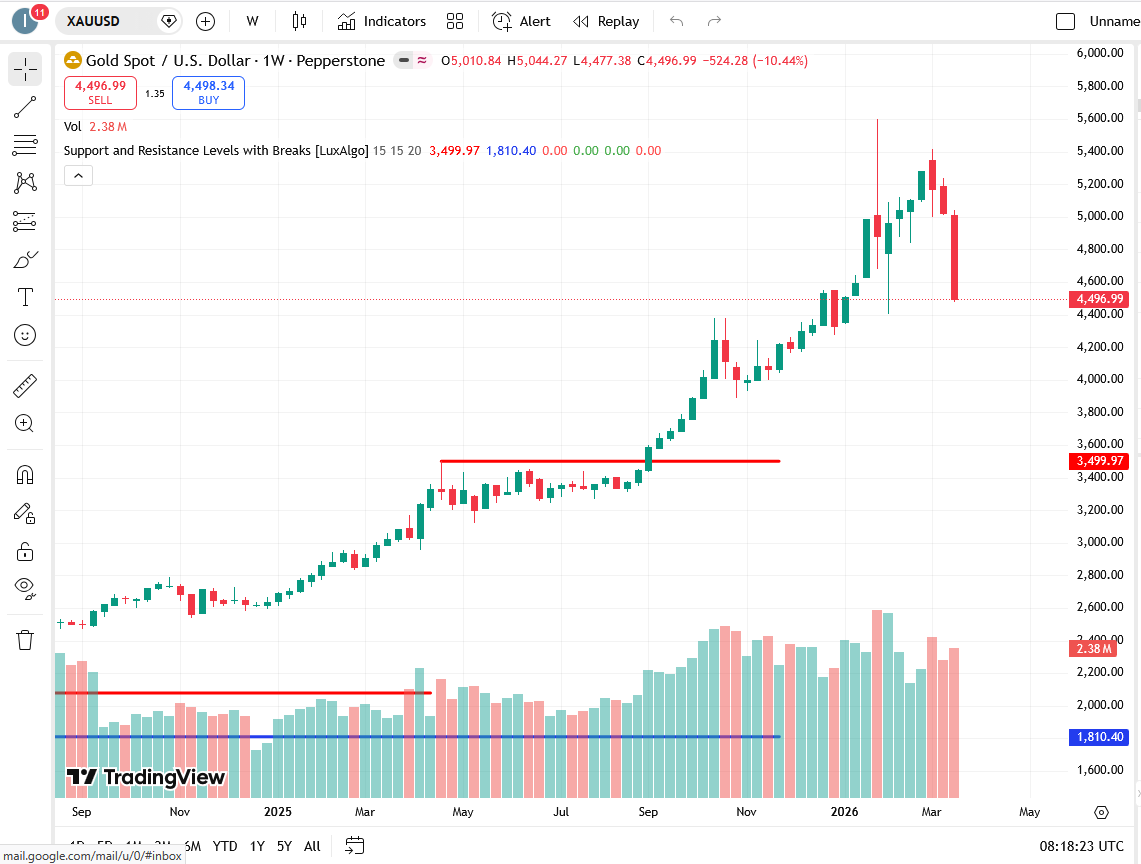
Last week's Fed announcement shook the market, and gold (XAU/USD) reacted strongly to the announcement and to the adjustment in interest rate expectations that followed. After going up and down a lot, gold is now trading near the 4,490 zone at the start of 23-27 March, 2026 and is taking a breather from its recent price swing.
You could say that initially based on the Fed announcement, gold went into a neutral phase of consolidation as inflation expectations, US real yields, and US dollar direction were the main factors being adjusted in the markets.
Gold still plays the role of a macro asset, promoted by several factors at the same time with the primary drivers being:
- US real interest rates
- US dollar strength
- Inflation expectations
- Risk appetite in financial markets
Firstly, the market is on the fence between the effects of monetary policy and that of economic fundamentals, with the spotlight falling on the latter.
For its part, the metal is closely following a more-or-less steady macro-environment where inflation remains above the target despite being moderately tamed, and the US economy is displaying a few contradictory indicators.
Major motifs that will depict gold performance this week:
- Federal Reserve interest rate expectation adjustment
- Constancy of inflation statistics
- US Treasury yields changes
- Risk sentiment switch in equity markets
There are fewer factors leading the market here, and gold is just moving up and down as usual, without a strong handle on its direction.
Technical Analysis for Gold (XAUUSD)
Lastly, there is the technical breakout risk that still looms large, and a departure from the 1.1525-1.1630 range would most probably lead to a stronger directional move.
Current Market Structure
Gold technically shows a neutral to slightly bearish short-term price action pattern within an overall bull market.
Here is a brief summary of gold price positions in relation to moving averages:
- Currently prices are below the short-term moving averages (10, 20 periods)
- They are also above the medium and long-term moving averages (30, 200 periods)
It looks like the current correction is just another retracement of the dominant upward trend, so no structural reversal appears to have taken place so far.
Prices are staying between 4,400-4,500, coinciding with the short-term equilibrium area.
Moving Averages and Trend Structure
On the whole, FA depiction presents divergence between relatively weak short term and quite strong long term trends.
Short-term moving averages such as 10 and 20 period exponential moving averages lay above price at the moment, thus, besides serving as resistance levels, they also verify the fact that in the short term the momentum has gone down.
At the moment, the 30-period MA lying close to 4,400 is also working as a major reference point.
Lower down, 50, 100, and 200 MAs are still way below the current price kingly confirming that the overall bull phase is alive and kicking.
This is very important because a zone of resistance of4,600-4,850 and a zone of support of4,400-4,300 will also be in focus for quite a while.
Momentum Indicators
Momentum tools indicate that few characters are shaping the play a balanced mood and a slightly weak feeling environment.
The Relative Strength Index (RSI) hovers near neutral, meaning no significant momentum in any direction is present.
The MACD resists in negativeness as a signal of short-term weakness.
On the other hand, some oscillators like Williams %R are close to oversold, thus creating the chance for a short-term upward movement.
There spread indicators of the velocity of the trend that indicate strength, the main trend is still moving towards the upper end.
Key Support and Resistance Levels
Major supports and resistance levels to watch this week:
Resistance Levels
- 4,510: First resistance
- 4,630-4,850: Resistance band
- 5,000: Large psychological resistance
- 5,050+: Breakout zone
Support Levels
- 4,00: First support
- 4,300: Major support
- 4,060: Medium-term support
- 3,830: Structural support
It is likely that the market will continue its sideways move as long as gold adheres to the 4,300 to 4,630 corridor.
Bullish Scenario
Gold, in our view, may encounter a strong bullish move if it attains stability above 4,400, 4,500 prices and advances breaking 4,630 level.
Most likely, after the breakout, the price will test the following levels:
- 4,850
- 5,000
This could happen were the support coming from falling real yields, weak US dollar and less vibrant US economy be in place.
The same could be true on the basis of a rise in safe-haven buying as market risk aversion increases.
Bearish Scenario
If gold breaks 4,400 support level and also drops below 4,300, the bearish scenario would be favored.
Then, the move might well be to the following levels:
- 4,060
- 3,830
Possible causes for the above scenario include strong US economic data, rising US Treasury yields, or renewed strength in the US dollar.
In spite of this, the broader upward trend will still be intact as long as gold doesn't go below the 4,000-3,800 region.
Gold Fundamental Drivers
United States Economic Data
Gold stays reactive to the release of US economy numbers.
Among the most important pieces of data, this week are:
- JOLTs Job Openings
- Retail Sales (MoM)
- ISM Manufacturing PMI
- ISM Services PMI
These economic indicators are very helpful in forming expectations of economic growth, inflation, and interest rates.
Federal Reserve Expectations
Since the last FOMC meeting, the market has been placing emphasis on data confirmation.
Gold would be responding in a very sensitive manner to the changes in the expectations about:
- Rate cut timing
- Future inflation dynamics
The end result of this is that a more contractionary stance from the Federal Reserve will be negative for gold, while doveish signals will be supportive.
US Real Yields and Dollar
US real interest rates are undoubtedly the main factor behind gold.
Gold already experienced a price drop after the announcement, rising real yields because, at the same time it has an inverse relation with the dollar, so dollar strength also put pressure on the price.
On the contrary, dollar weakness can be supportive of gold.
This Week's Gold High Impact Events
- JOLTs Job Openings: US labor demand
- RetailSales(MoM): Consumer activity
- ISMManufacturingPMI: Industrial performance
- ISMServicesPMI: Economic momentum
- NFPPositioning: End-of-week expectations
Risk Considerations for Gold This Week
Here are a few situations that might markedly affect the movements of gold prices:
- First, US economic data surprises can change expectations about interest rates.
- Second, movements in US Treasury yields might directly impact gold prices.
- Third, US dollar volatility is bound to influence gold owing to their inverse relationship.
Finally, technically, breakout risk is equally present, since a move away from the 4,300-4,630 range probably will set up a stronger momentum.

Risk disclaimer: CFDs are complex instruments and come with a high risk of losing money rapidly due to leverage. You should consider whether you understand how CFDs work and whether you can afford to take the high risk of losing your money. Never deposit more than you are prepared to lose. Professional client’s losses can exceed their deposit. Please see our risk warning policy and seek independent professional advice if you do not fully understand. This information is not directed or intended for distribution to or use by residents of certain countries/jurisdictions including, but not limited to, USA & Countries included in the OFAC sanction list. The Company holds the right to alter the aforementioned list of countries at its own discretion.
TIOmarkets offers an exclusively execution-only service. The views expressed are for information purposes only. None of the content provided constitutes any form of investment advice. The comments are made available purely for educational and marketing purposes and do NOT constitute advice or investment recommendation (and should not be considered as such) and do not in any way constitute an invitation to acquire any financial instrument or product. TIOmarkets and its affiliates and consultants are not liable for any damages that may be caused by individual comments or statements by TIOmarkets analysis and assumes no liability with respect to the completeness and correctness of the content presented. The investor is solely responsible for the risk of his/her investment decisions. The analyses and comments presented do not include any consideration of your personal investment objectives, financial circumstances, or needs. The content has not been prepared in accordance with any legal requirements for financial analysis and must, therefore, be viewed by the reader as marketing information. TIOmarkets prohibits duplication or publication without explicit approval.
Join us on social media

Behind every blog post lies the combined experience of the people working at TIOmarkets. We are a team of dedicated industry professionals and financial markets enthusiasts committed to providing you with trading education and financial markets commentary. Our goal is to help empower you with the knowledge you need to trade in the markets effectively.
Related Posts