USD/JPY Forecast for the Week of 23rd March 2026
BY TIOmarkets
|March 23, 2026USD/JPY Market Overview
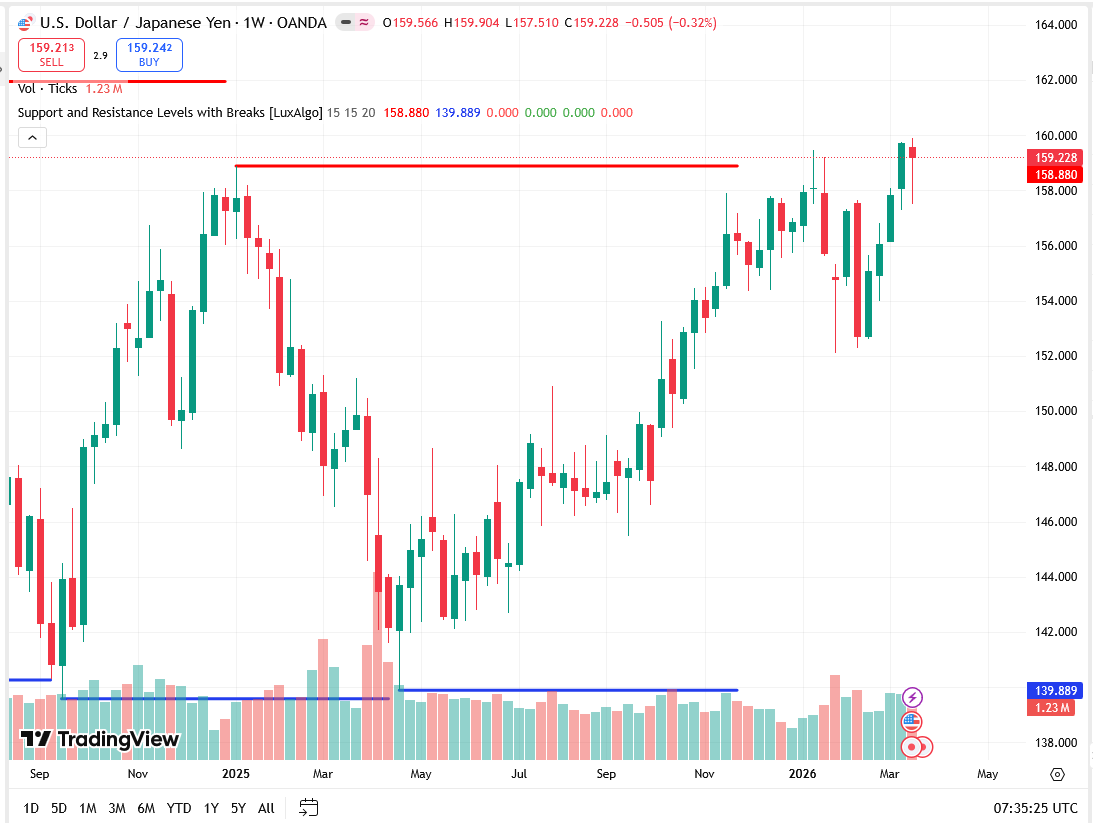
During the week of 23-27 March, 2026, USD/JPY is around the 159.20 level and is consolidating just below 160, a main psychological level after last week's central bank-induced volatility. The pair is still mostly a reflection of the global yields gap trade, which in essence is the trading of US Treasury yields against Japanese government bond yields. The Fed's decision has led to a change in expectations of US monetary policy, whereas the Bank of Japan’s stance remains accommodative, thereby structurally supporting the USD/JPY.
Meanwhile, USD/JPY also keeps reflecting the global appetite for risk:
- When the risk sentiment is positive, the pair tends to go up due to the demand for carry trade
- When the risk sentiment is negative, the yen is more likely to appreciate as it is known as a safe haven
This is a pretty delicate technical space for the pair:
- There is a bullish trend below the surface
- Around 160, the pair gets more sensitive. This is a historical level at which intervention from Japan is considered possible
Among the main things that impact the USD/JPY this week are:
- The factors affecting UST yields
- Market positioning around Fed's rate hike decision
- Bank of Japan policy
- Risk appetite, stock market performance
In sum, USD/JPY is still strongly bullish, but there is some risk of correction due to positioning, since it is near a resistive level.
Technical Analysis for USD/JPY
Current Market Structure
Technically, USD/JPY shows a strong, clear bullish movement in higher timeframes.
Price is at the moment:
- Outpacing all important moving averages (10, 200 periods)
- Keeping a pattern of higher highs and higher lows
But with this, the pair has almost reached the climax of the trend as the price is nearing the resistance level of 160, which is also the level for volatility and intervention concerns.
That means, despite the fact that the overall trend is still hanging there, the chance of short-term consolidation or even corrective pullbacks is getting bigger.
Moving Averages and Trend Structure
Moving averages strongly indicate a very bullish sentiment.
10-, 20-, and 30-period EMAs are several pips away from the recent prices and currently serve as the levels of support during market dips.
The 50-period moving average around 153.00 is the first relevant line of support before trend extension, whereas the 100- and 200-period averages stay well below, signaling a long-term bullish trend.
The 155.00-153.00 region is the most crucial support to keep the present structure running.
Momentum Indicators
A bullish momentum with some signs of exhaustion has been shown by momentum indicators.
Relative Strength Index (RSI) is still bullish but away from the overbought level, which implies that there is still room for an upward move.
MACD is still in a strong buy mode, which also supports the trend.
Nevertheless, some of the younger timeframe indicators show a decline in momentum, and oscillators like Williams %R are ticking into overbought.
ADX shows that the underlying trend power remains just okay without signs of acceleration, which means that the market could easily enter consolidation phase.
Key Support and Resistance Levels
This week's price action:
Resistance lLevels
- 160.00: Major psychological resistance
- 163.80: Short-term breakout target
- 166.20: Extended resistance
- 170.00: Macro resistance zone
Support Llevels
- 158.50: Immediate support
- 155.50: Key support zone
- 153.00: Trend support (50 MA)
- 150.00: Major structural support
The 160 level remains the main focus of technical battles this week.
Bullish Scenario
In the case,bullish closes outweigh bears, then the 155.50 support must hold for the pair to continue moving upwards.
A breakout and confirmation of 160 could get the pair going, at least in the direction of:
- 163.80
- 166.20
US Treasury yields increasing, US economic data strengthening, and the Federal Reserve Bank of Japan policy divergence becoming more pronounced could be supporting
factors in this scenario. With global risk sentiment either stable or improving, USD/JPY may also be benefiting from to carry trade demand, thereby leading to further gains.
Bearish Scenario
If the pair fails to go above 160, and comes down below 158.50 support, then there is a possibility that a bear scenario could be played out. If so, the pair may even see some downsides toward:
- 155.50
- 153.00
This kind of situation usually arises from lower UST yields, Fed going dovish or risk aversion on the increase. Plus, the likelihood of Japanese authorities verbally or directly intervening might be at a point where the pair is quite aggressive towards or above 160.
USD/JPY Fundamental Drivers
US Treasury Yields
With USD/JPY being a derivative of US real yields, this actually makes bond market movements a major source of influence. Typically, the pair is going to be helped by rising yields, and conversely, it is going to experience declines when yields fall.
Federal Reserve Expectations
After the FOMC meeting, attention has shifted to the release of economic data so that the market can gauge whether rate cuts will be brought forward or delayed. The Fed's reliance on data keeps USD/JPY very much reactive to economic releases.
Bank of Japan Policy
The highly accommodative monetary policy of the Bank of Japan is keeping Japanese yields quite low. Still, the attention is on:
- Possible policy normalization
- Intervention risk
The above are becoming increasingly important as the pair nears 160.
Global Risk Sentiment
The big picture is that global financial market conditions have an impact on USD/JPY as well. Risk-on situations, in general, are positive for USD/JPY through carry trades, whereas risk-off situations favor the yen.
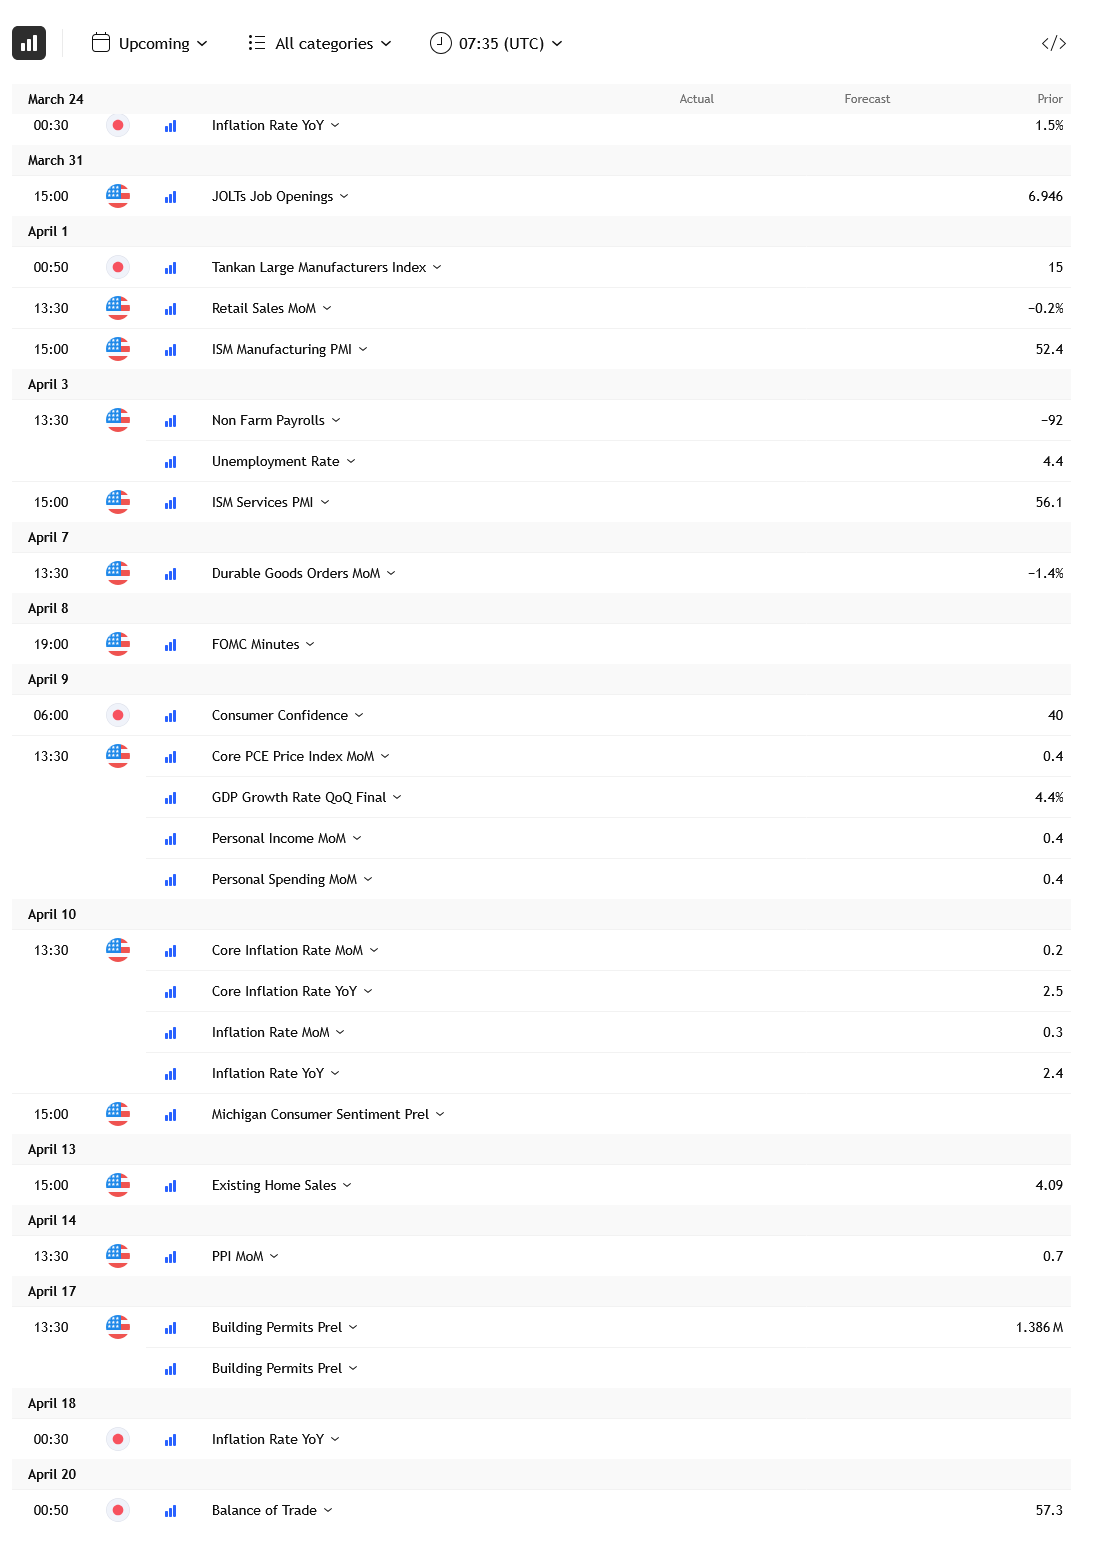
This Week's USD/JPY High Impact Events
- JOLTs Job Openings: US Labor Demand Indicator
- Retail Sales: Consumer Activity
- ISM Manufacturing PMI: Industrial Momentum
- ISM Services PMI: Economic Activity
- Japan Inflation Data (YoY): Domestic Price Trends
- Central Bank Communication: Fed and BoJ-Related Expectations
Risk Considerations for USD/JPY This Week
A number of risks may have a bearing on USD/JPY market moves:
- One is yield volatility in US Treasury markets that could have a direct impact on the pair.
- Another is changes in policy expectations after data that could cause market repositioning.
- The third is intervention risk from the Japanese side, especially near critical levels.
And finally, technical breakout risk is high and a move above or below 160 is likely to unleash strong directional momentum.

Risk disclaimer: CFDs are complex instruments and come with a high risk of losing money rapidly due to leverage. You should consider whether you understand how CFDs work and whether you can afford to take the high risk of losing your money. Never deposit more than you are prepared to lose. Professional client’s losses can exceed their deposit. Please see our risk warning policy and seek independent professional advice if you do not fully understand. This information is not directed or intended for distribution to or use by residents of certain countries/jurisdictions including, but not limited to, USA & Countries included in the OFAC sanction list. The Company holds the right to alter the aforementioned list of countries at its own discretion.
TIOmarkets offers an exclusively execution-only service. The views expressed are for information purposes only. None of the content provided constitutes any form of investment advice. The comments are made available purely for educational and marketing purposes and do NOT constitute advice or investment recommendation (and should not be considered as such) and do not in any way constitute an invitation to acquire any financial instrument or product. TIOmarkets and its affiliates and consultants are not liable for any damages that may be caused by individual comments or statements by TIOmarkets analysis and assumes no liability with respect to the completeness and correctness of the content presented. The investor is solely responsible for the risk of his/her investment decisions. The analyses and comments presented do not include any consideration of your personal investment objectives, financial circumstances, or needs. The content has not been prepared in accordance with any legal requirements for financial analysis and must, therefore, be viewed by the reader as marketing information. TIOmarkets prohibits duplication or publication without explicit approval.
Join us on social media

Behind every blog post lies the combined experience of the people working at TIOmarkets. We are a team of dedicated industry professionals and financial markets enthusiasts committed to providing you with trading education and financial markets commentary. Our goal is to help empower you with the knowledge you need to trade in the markets effectively.
Related Posts