S&P 500 Forecast for the Week of 23rd March 2026
BY TIOmarkets
|March 23, 2026S&P 500 Market Overview
The S&P 500 is starting the week of 23-27 March, 2026 at a level close to 6,500. However, this level represents a consolidation phases following volatility in the stock market after the most recent Federal Reserve meeting resulted in macro data being re-priced..
Following a strong rally, US shares corrected after the interestrate path was reassessed, along with economicgrowth, and the effect increasedtreasuryyieldshadonequityvaluations.
The index is also responding well to macroeconomicdata, especially where it relates to labor market conditions, growth, and inflation. The Federal Reserve is dependent on data for its decision and this is been markedly more evident just recently, leading to an increase in market sensitivity.
For now, the S&P 500 is showing a fine line between strong economic activity and tighter financial conditions, with the investor community going back and forth between risk-on and defensive positioning.
The market is being swayed by:
- Federal Reserve policy expectations
- US economic data (growth and labor market)
- Treasury yield movements
- Equity market sentiment and positioning
Consequently, we see the index moving towards a scenario where macro releases dictate whether recent market retracement finds support or leads to further declines.
Technical Analysis for S&P 500
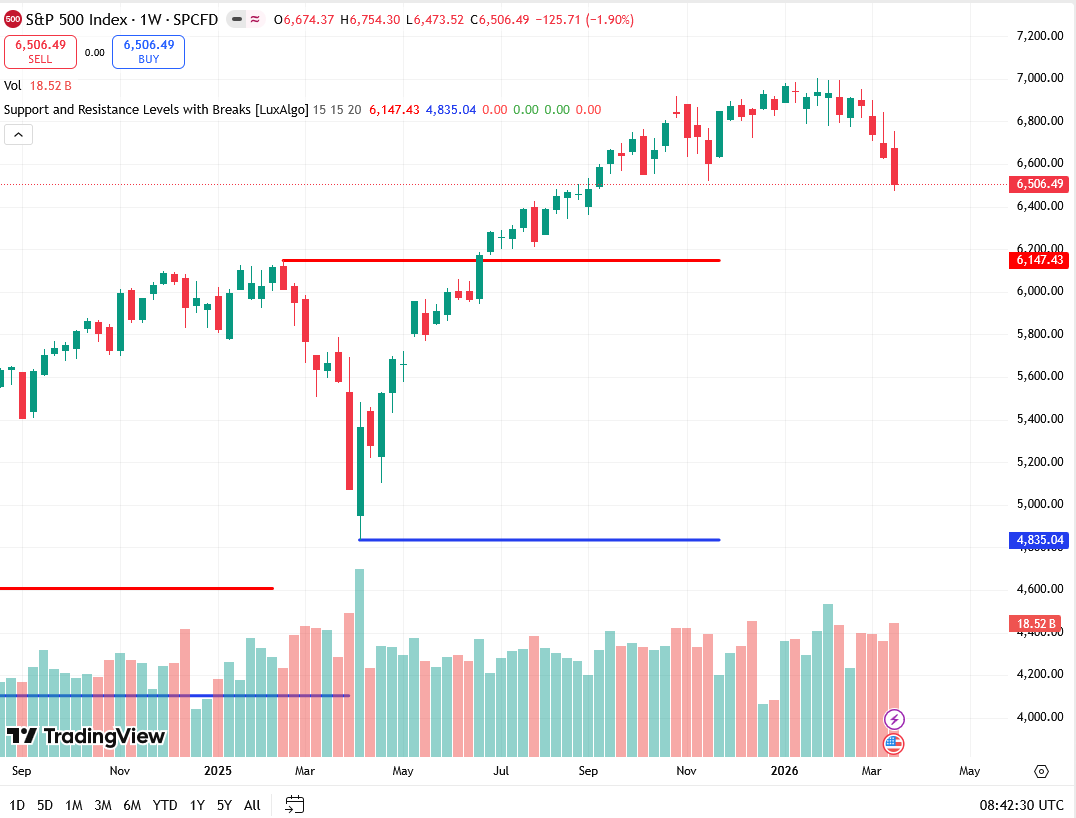
Current Market Structure
The S&P 500 is currently experiencing a short-term bearish correction against the backdrop of an overall bullish trend.
The current state of the S&P 500 price:
- Trading under short-term moving averages (10, 30 periods)
- Checking the 50-period moving average (~6,500)
- Far above long-term moving averages (100, 200 periods)
Such a setup indicates that the market is possibly conducting a corrective consolidation and is not signaling a structural reversal at this point.
Pricing action around the 6,450-6,550 area is a major pivot point where buyers and sellers appear to be evenly matched right now.
Moving Averages and Trend Structure
Moving-averages confirm that the market declined in the short term but the long-term trend remains good. Thanks to the 10-, 20-, and 30-period EMAs which lead the price and act as resistance, confirming the slackening of upward momentum. In fact, the 50-period moving average (around 6, 500) serves double duty as the market's present major support level. In addition, the 100- and 200-period moving averages are far below, giving the S&P 500 a strong bullish outlook in the longer term. The 6,680-6,760 ranges now hold strong resistance levels while 6,450-6,500 comprise critical support areas.
Momentum Indicators
Momentum indicators reveal that the market environment remains challenging in the short term while there are signs of recovery in the immediate future. On the Relative Strength Index (RSI) front, it is currently below the middle mark, a situation that usually points to bearish momentum. MACD is generating a sell signal, strongly suggesting continuing short-term weakness. On the other hand, being in oversold territory, Williams %R is indicative of possible short-term market rebounds. Meanwhile, the low level of ADX readings explains the weak trend and implies the possibility of the range-bound price action.
Key Support and Resistance Levels
For the time being, here are the most important levels to watch:
Resistance Levels
- 6,650: Level of closest resistance
- 6,700-6,760: Zone of major resistance
- 7,000: Psychological resistance level
- 7,050+: Level of extended breakout
Support Levels
- 6,500: Level of closest support
- 6,450: Key short-term support level
- 6,200: Pivot support
- 6,080: Medium-term support
The longer the S&P 500 stays in the 6,450-6,700 range, the more likely it is that the market will stay in consolidation.
Bullish Scenario
A bullish scenario could happen if the S&P 500 manages to get above the 6,450-6,500 support zone and the 6,650-6,700 resistance levels.
That could lead to:
- 6,760
- 7,000
In this scenario, treasury yield declines, softer economic data from the US, and better risk sentiment are favorable factors.
If the markets start pricing in a more accommodative Federal Reserve, then equity markets could turn their momentum upwards again.
Bearish Scenario
If the index breaks down below 6,450 and can't even hold the 6,500 level, the situation will become more bearish.
Then, possible downside targets include:
- 6,200
- 6,080
Strong economic data from the US, higher treasury yields, or a hawkish stance on Federal policy could lead to this happening.
Tighter financial conditions could result in equity valuations coming under pressure, particularly in sectors that rely on growth.
S&P 500 Fundamental Drivers
US Economic Data
The S&P 500 remains highly sensitive to US macroeconomic releases.
Key data this week include:
- JOLTs Job Openings
- Retail Sales (MoM)
- ISM Manufacturing PMI
- ISM Services PMI
These indicators give us a look at consumer demand, economic demand, and business activity.
Federal Reserve Expectations
The FOMC meeting has led to a stronger market focus on data validation.
Perhaps the most important question is whether a higher-for-longer Federal stance can be maintained or whether they will have a more accommodating view.
This dynamic uses liquidity conditions and interest rates to influence equity valuations.
Treasury Yields and Financial Conditions
US equity markets react quickly when Treasury yields change. When yields rise, stocks come under pressure from raised discount rates, and when they fall, valuations gain more support. Financial conditions are one of the most important factors in how macroeconomic data affects equity performance.
Risk Sentiment
The S&P 500 is an important indicator of global risk appetite.
Risk-on conditions support equity inflows, while risk-off sentiment may trigger defensive positioning and increased volatility.
This Week's S&P 500 High Impact Events
- JOLTS Job Openings: A measure of labor market demand
- Retail Sales (MoM): A reflection of consumer spending behavior
- ISM Manufacturing PMI: A gauge of the manufacturing sector's health
- ISM Services PMI: A measure of the business conditions in the services sector
- NFP Positioning: Market expectations for the nonfarm payroll report released at the end of the week
Risk Considerations for S&P 500 This Week
Market movements could be affected by numerous risk factors:
- To start with, unexpected macroeconomic data may rapidly change expectations.
- Then, Treasury yield fluctuations could have a direct impact on equity valuations.
- Moreover, shifts in Federal Reserve expectations will also influence market sentiment at times.
Even so, there is still a high level of risk for technical breakouts, as any move beyond the 6,450-6,700 range is likely to bring about stronger directional momentum.

Risk disclaimer: CFDs are complex instruments and come with a high risk of losing money rapidly due to leverage. You should consider whether you understand how CFDs work and whether you can afford to take the high risk of losing your money. Never deposit more than you are prepared to lose. Professional client’s losses can exceed their deposit. Please see our risk warning policy and seek independent professional advice if you do not fully understand. This information is not directed or intended for distribution to or use by residents of certain countries/jurisdictions including, but not limited to, USA & Countries included in the OFAC sanction list. The Company holds the right to alter the aforementioned list of countries at its own discretion.
TIOmarkets offers an exclusively execution-only service. The views expressed are for information purposes only. None of the content provided constitutes any form of investment advice. The comments are made available purely for educational and marketing purposes and do NOT constitute advice or investment recommendation (and should not be considered as such) and do not in any way constitute an invitation to acquire any financial instrument or product. TIOmarkets and its affiliates and consultants are not liable for any damages that may be caused by individual comments or statements by TIOmarkets analysis and assumes no liability with respect to the completeness and correctness of the content presented. The investor is solely responsible for the risk of his/her investment decisions. The analyses and comments presented do not include any consideration of your personal investment objectives, financial circumstances, or needs. The content has not been prepared in accordance with any legal requirements for financial analysis and must, therefore, be viewed by the reader as marketing information. TIOmarkets prohibits duplication or publication without explicit approval.
Join us on social media

Behind every blog post lies the combined experience of the people working at TIOmarkets. We are a team of dedicated industry professionals and financial markets enthusiasts committed to providing you with trading education and financial markets commentary. Our goal is to help empower you with the knowledge you need to trade in the markets effectively.
Related Posts