S&P 500 Forecast for the Week of 30th March 2026
BY TIOmarkets
|March 30, 2026S&P 500 Market Overview
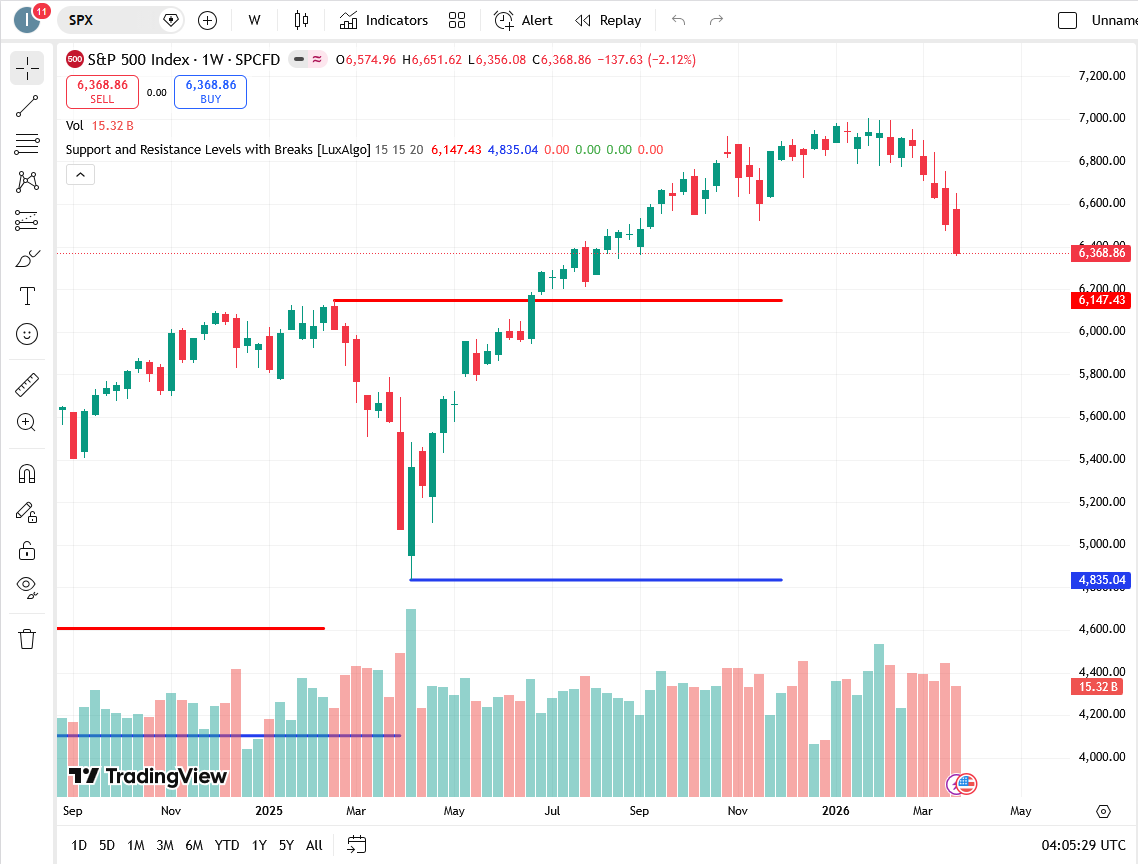
The S&P 500 starts the week of March 30–April 3, 2026 trading near 6,370, most likely a bit beneath the consolidated range's lower edge that weighed after the correction seen in March's second half.
The index has been retreating from the highs of the 6,700-6,800 area after the FOMC meeting's fresh pricing resulting in reduced expectations for interest rate hikes. The market has mainly moved down slowly on the chart, which mirrors the combination of tighter financial conditions and fresh pressure from rising US yields.
While the retreat shows a weakening side of price movement, the overall framework is very much intact. The S&P 500 has been trading in a longer-term upward trend and it seems like the current dip is a technical pullback rather than a reversal of the uptrend.
There has been an increase in short-term volatility as the markets switch from a phase of moves being driven by central banks to a data-oriented environment where US macroeconomic releases have an impact.
Major changes that are setting the market agenda include:
- Steady US economic performance, particularly in the services sector
- Main focus remains on US labor market statistics given that it's NFP week
- Market sensitivity to US Treasury yields along with financial conditions
- Federal Reserve policy expectations continue to exert influence
The aforementioned combination of factors is creating the present slightly bearish consolidation structure while traders await new macroeconomic events.
For now, the S&P 500 is staying inside a range, with broader directional conviction limited given that high-impact data is yet to be released.
Technical Analysis for S&P 500
Current Market Structure
At the weekly level, the S&P 500 remains on a bullish macro trend, however, recent momentum has taken a hit.
The pullback from the 6,700-6,800 zone all the way down to 6,300 is a normal retracement pattern for a major uptrend.
Along with that, a bearish sentiment deviating from the positive momentum is visible lately as the index has experienced two lower peaks on the chart since mid-March.
Yet, this fall is still well-managed and the important support lines of the structure are yet to be violated, suggesting that the pullback is proceeding in a regulated manner.
Moving Averages
Looking at the moving averages, the signals reinforce the notion of the pullback being just temporary.
- 20-day moving average is situated close to the 6,720-6,800 price area (currently above the price, serves as immediate resistance)
- 50-day moving average is approximately around the 6,500 price level (which is one of our main pivots)
- 100-day moving average currently trades near 6,080
- 200-day moving average is approximately at 5,450
This pattern is indicative of a short-term correction occurring within a longer-term bullish framework.
The 50-day moving average close to 6,500 is, on the other hand, the most critical benchmark from the technical standpoint for the current phase of the market.
Momentum Indicators
Momentum on the market is currently neutral with a slight bearish tilt. The RSI indicator is placed below the median level thus pointing to diminished buying strength. On the other hand, the MACD is still below zero which reflects the presence of a short-term downtrend.
On the other hand, the oscillators are on the verge of oversold conditions which in turn might lead to short-term stabilization and positive corrective price action. Overall, momentum points to loss of direction and a consolidation phase of the market.
Key Support and Resistance Levels
Here are the main technical price levels.
Resistance Levels
- 6,450: Immediate resistance
- 6,650: Primary resistance level
- 6,700–6,800: Major resistance zone
- 7,000: Upper resistance
Support Levels
- 6,350: Immediate support
- 6,200: Key structural support
- 6,080: Secondary support
- 5,800: Medium-term support
Until the S&P 500 is in the range of 6,200 and 6,650, it is quite likely for the market to continue to be in the range trading mode.
Bullish Scenario
A bullish scenario may unfold in the event that the S&P 500 gains composure above 6,350 and starts gaining upward momentum.
Exceeding 6,650 would be a first technical indication of renewed buying interest.
The index could then head towards:
- 6,700
- 6,800
This could be prompted by weaker-than-expected US economic data, especially a soft Non-Farm Payrolls report that may lower yield pressures and thereby support equities.
Furthermore, a general improvement in market sentiment might also support the index.
Under such conditions, the S&P 500 would be likely to test the upper end of its current range.
Bearish Scenario
The bearish angle would become dominant if the S&P 500 does not hold the 6,350 level and instead drops below 6,200.
This, in turn, might set off a deeper corrective phase aimed at:
- 6,080
- 5,800
This scenario may materialize if US economic data demonstrates persistent strength, thereby heightening the view that the Federal Reserve could keep interest rates elevated for an extended period.
More robust data and climbing yields would potentially add to the selling pressure on stocks.
Instances of risk-off attitude could also weigh on the index.
Interestingly enough, the longer-term trend would remain positive as long as prices stay above 5,800.
S&P 500 Fundamental Drivers
A handful of key macro factors are defining the S&P 500 prospects this week.
United States Economic Data
First and foremost, focus will be on the US macroeconomic calendar. The data released so far depicts a mixed but largely resilient economy. Indicators of business activity, especially ISM Services, show a degree of strength and therefore hint that the US economy is growing at a moderate pace of growth.
On the other hand, hints of slowing in the labor market have been seen in the earlier employment data. And now, the economic data of this week in particular, Non-Farm Payrolls, ISM indices, and retail sales, will be very telling as to whether the economy is maintaining its pace or slowing down.
Strong economic data might elevate expectations for earnings and at the same time push yields upward. Contrarily, weak data could lift stocks primarily through lower yields.
Federal Reserve Expectations
At the moment, the market is in the process of re-evaluating the timing and extent of possible rate cuts. The Federal Reserve is fully committed to remaining data-dependent and the members of the FOMC are watching inflation and the labor market very closely.
In a case where the data continues to support a resilient economy, the rate cut expectations might get delayed further leading to yield support and equity market pressures. Weaker data, on the other hand, especially if it is related to employment figures, would increase expectations of policy easing and support associated gains in equity markets.
Inflation and Growth Dynamics
Changes in the rate of inflation and economic growth have long been at the core of valuations of stocks. Low inflation together with decelerating growth are features of an environment which is generally more balanced while adjustments in monetary policy usually come under pressure in the case of sustained high inflation.
Policy and Yield Dynamics
The stock market is extremely sensitive to the way monetary policy and yield levels interact.
Generally, higher yields negatively impact stock valuations whereas lower yields are supportive and allow the stock market to rally.
This Week's S&P 500 High Impact Events
The S&P 500 is likely to see changes in volatility due to several economic factors.
United States
- Non-Farm Payrolls (NFP): This is the most crucial single indicator of the employment situation. A robust jobs report is likely to weigh on stocks due to resulting higher yields, whereas a weak one could work in their favor.
- UnemploymentRate: Gives further details on the labor market conditions.
- ISMManufacturingPMI: Shows the degree of activity and growth in the manufacturing industry.
- ISMServicesPMI: The performance of the services sector is revealed by this key leading indicator.
- RetailSales: It is a measure of the strength of the consumer.
- JOLTsJobOpenings: It is about how much labor demand there is in the economy.
Central Bank Communication
FederalReserveSpeeches: Statements from Fed members are closely watched to gauge the market's interpretation of the Federal Reserve's future policy and rate path.
Risk Considerations for S&P 500 This Week
There are a number of things that could create volatility in the S&P 500.
The risk most prominently remains around outsized surprises in macroeconomic data with the Non-Farm Payrolls release being the standout.
Also, the statements from central banks might affect rate expectations.
US Treasury yield changes continue to be a major factor influencing stock market valuations.
Lastly, technical breakouts are expected to get a lot of attention during trading.
An emphatic break outside 6,200–6,650 range would very likely lead to significant directional momentum.

Risk disclaimer: CFDs are complex instruments and come with a high risk of losing money rapidly due to leverage. You should consider whether you understand how CFDs work and whether you can afford to take the high risk of losing your money. Never deposit more than you are prepared to lose. Professional client’s losses can exceed their deposit. Please see our risk warning policy and seek independent professional advice if you do not fully understand. This information is not directed or intended for distribution to or use by residents of certain countries/jurisdictions including, but not limited to, USA & Countries included in the OFAC sanction list. The Company holds the right to alter the aforementioned list of countries at its own discretion.
TIOmarkets offers an exclusively execution-only service. The views expressed are for information purposes only. None of the content provided constitutes any form of investment advice. The comments are made available purely for educational and marketing purposes and do NOT constitute advice or investment recommendation (and should not be considered as such) and do not in any way constitute an invitation to acquire any financial instrument or product. TIOmarkets and its affiliates and consultants are not liable for any damages that may be caused by individual comments or statements by TIOmarkets analysis and assumes no liability with respect to the completeness and correctness of the content presented. The investor is solely responsible for the risk of his/her investment decisions. The analyses and comments presented do not include any consideration of your personal investment objectives, financial circumstances, or needs. The content has not been prepared in accordance with any legal requirements for financial analysis and must, therefore, be viewed by the reader as marketing information. TIOmarkets prohibits duplication or publication without explicit approval.
Join us on social media

Behind every blog post lies the combined experience of the people working at TIOmarkets. We are a team of dedicated industry professionals and financial markets enthusiasts committed to providing you with trading education and financial markets commentary. Our goal is to help empower you with the knowledge you need to trade in the markets effectively.
Related Posts