S&P 500 Forecast for the Week of 6th April 2026
BY TIOmarkets
|April 6, 2026S&P 500 Market Overview
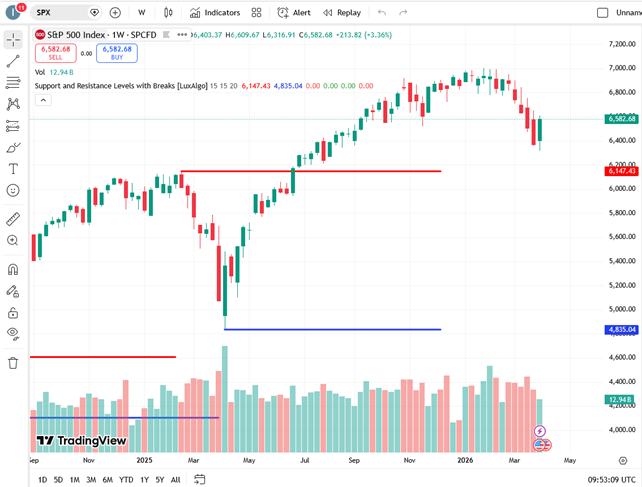
The S&P 500 ended the week of 6-10 April 2026 trading near 6,580. The index appears to be at the central point of the recent consolidation range after the sell-off on the last trading day of March.
The market has corrected its upswing from the resistance levels around the 6700–6,800 area. Since then, the market has managed to stabilize near support levels and is showing early consolidation.
Despite the technical decline, the overall market performance is positive. Currently, the S&P 500 is trading within a long-term bull market pattern, and the recent decline looks to be a simple technical pullback rather than a reversal.
Short-term volatility has increased since markets are now transitioning from moves led by central banks to a data-driven environment, with US macroeconomic releases and financial conditions being the main focus.
Some developments that impact the market are:
- Strong US economic activity results, especially in services
- Consideration of inflation dynamics and consumer demand
- Sensitivity to US Treasury yields and financial conditions
- Federal Reserve policy expectations remain a strong influence
These things presently create a slightly bearish-to-neutral range of consolidation, as investors reconsider macroeconomic conditions.
For the moment, the S&P 500 is still within a defined range, and directional conviction is limited ahead of the next data release.
Technical Analysis for S&P 500
Current Market Structure
On the weekly chart, the S&P 500 is still in a macro bull phase, but short-term momentum has faded.
The drop off from the 6,700–6,800 range to the 6,500–6,400 level is the normal retracement in an upward major trend.
Under a short-term lens, price behavior shows a minor bearish bias, as the index has been declining, forming lower highs since mid-March.
On a positive note, this downward trend is under control and, so far, has failed to breach the critical support levels that define the structure.
Moving Averages
Moving averages align well with the notion of a limited-period pullback.
- 20-period MA: Close to 6,700–6,800 (price is below, short-term resistance)
- 50-period MA: Around 6,500 (very significant level)
- 100-period MA: Almost at 6,100
- 200-period MA: Roughly 5,450
From this, it can be inferred that a short-term pullback is occurring in the context of a long-term bull market.
The 50-period simple moving average just above 6,500 is the most significant technical reference for the current phase of the market.
Momentum Indicators
Momentum shows an almost flat to slightly negative bias. With RSI being under 50, it indicates that bullish momentum is fading. Moreover, MACD, while slightly negative, now also supports the idea of short-term weakness.
On the other hand, oscillators are nearing oversold levels, and this might be a sign of short-term support or corrective rebounds. To sum up, momentum is a mixed bag and points to a loss of market direction along with consolidation.
Key Support and Resistance Levels
Below are the most important technical levels for this week.
Resistance Levels
- 6,650: First resistance level
- 6,700–6,800: Main resistance level
- 7,000: Psychological resistance
- 7,050: Strong resistance
Support Levels
- 6,500: An important psychological level
- 6,400: A strong level of support
- 6,200: Further support
- 6,080: Support in the medium-term
As long as the S&P 500 stays between 6,400 and 6,700, the market is likely to continue in a range-bound fashion.
Bullish Scenario
It’s possible that a bullish scenario may be set if the S&P 500 stabilizes above 6,500 and gradually gathers more upward momentum.
The fact that the market breaks the 6,700 resistance would be a technical indication of renewed buying strength.
Going further, the stock market could work its way to
- 6,800
- 7,000
Weaker economic numbers, especially inflation or growth, that would reduce the fear of higher interest rates, would be the fundamental basis for this development.
Simultaneously, equity markets could be supported by declining yields and improved risk sentiment.
The S&P 500 will then likely oscillate near the top of its current range.
Bearish Scenario
The negative setting would occur if the S&P 500 failed to maintain support near the 6,500 mark and break below 6,400.
A drop to the following levels could be triggered by such a move:
- 6,200
- 6,080
Such an outcome would occur if the US economic data showed a continuous recovery, continuing to reinforce expectations that the Federal Reserve may keep interest rates higher for longer.
Strengthening data and increasing yields could put more pressure on equity valuations.
Periods of risk aversion would also weigh on the index, especially if financial conditions are tightened further.
Regardless, the wider trend would likely be considered constructive as long as the price remains above 6,000.
S&P 500 Fundamental Drivers
A few macroeconomic factors dictate the S&P 500 outlook for the week ahead:
United States Economic Data
Without a doubt, it's the U.S. macroeconomic calendar. The recent bloom of data has been quite mixed but shows resiliance in the U.S. economy. In particular, the ISM Services indicator is strong, indicating a moderate expansion of the US economy.
On the other hand, labor market data and consumer-related indicators have shown some variability, increasing a sense of uncertainty surrounding growth sustainability. While the headline employment figures have been quite stable, volatility in labor market momentum is a focus.
This week's data release, especially of ISM indicators, consumer spending, and inflation-related reports, will be a major determinant of whether the U.S. economy is stabilizing or beginning to slow down.
Strong economic data may help support the earnings forecast, but there is a risk of an increase in yields, which puts pressure on equity valuations. On the other hand, weaker data may ease the pressure on yields and bolster equities.
Federal Reserve Expectations
Investors are recalibrating the timing and scope of the rate cuts, if any, made in the future. The Fed is highly data-dependent at present, with policymakers carefully checking changes in inflation and the labor market.
If the economic data does not show signs of slowing down, the chance of Fed rate cuts will be postponed, thus leading to higher yields and financial tightening, which should weigh on equities.
Alternatively, weaker data, particularly in terms of growth or inflation, could up the odds of future easing, which would be a positive for risk-taking assets.
Inflation Dynamics
Inflation continues to have the greatest impact on the equity markets. Price pressures have moderated from their peak periods, but new highs are still above the long-term target.
Fed policy could remain restrictive in order to counter persistent inflation, which in turn would limit equities. However, a steady fading of inflation might support valuations and risk appetite.
Policy and Yield Dynamics
The main factors influencing the equity markets continue to be the interaction of monetary policy and interest rates.
Higher interest rates mean a bigger discount applied to future earnings potential, thus negatively affecting equity valuations. On the contrary, reduced yields help equities by easing financial conditions.
The ongoing S&P 500 consolidation is a reflection of this phenomenon, whereby markets remain reactive to changes in treasury yields.
This Week's S&P 500 High-Impact Events
Many new pieces of economic news that may cause S&P 500 to be more volatile in the coming days.
United States
- ISMManufacturingPMI: This is a measure of manufacturing sector activity and overall economic momentum
- ISMServicesPMI: Being the largest component of the US economy, the services sector is a main focus indicator.
- Retail-Related Indicators: These indicators are a reflection of consumer demand and overall economic strength.
- Inflation-Related Indicators: Apart from being indicative of price dynamics, these also help to shape expectations of monetary policy.
Central Bank Communication
- Federal Reserve Speeches: Sometimes, the comments of Fed officials can be a major factor in setting expectations of interest rate changes and other policy directions.
Risk Considerations for S&P 500 This Week
Unanticipated macroeconomic data, particularly the growth and inflation indicators, would be a major risk factor for the S&P 500.
Central bank communication could lead to speculation on interest rate changes.
Fluctuations in treasury yields will remain a key factor in affecting the prices of equities.
Geopolitics or natural disasters combined with global risk sentiment may also affect positioning and flows.
Lastly, price action based on a technical breakout would be closely watched.
A clear breakout from the 6,400–6,700 range would likely produce a strong directional move.

Risk disclaimer: CFDs are complex instruments and come with a high risk of losing money rapidly due to leverage. You should consider whether you understand how CFDs work and whether you can afford to take the high risk of losing your money. Never deposit more than you are prepared to lose. Professional client’s losses can exceed their deposit. Please see our risk warning policy and seek independent professional advice if you do not fully understand. This information is not directed or intended for distribution to or use by residents of certain countries/jurisdictions including, but not limited to, USA & Countries included in the OFAC sanction list. The Company holds the right to alter the aforementioned list of countries at its own discretion.
TIOmarkets offers an exclusively execution-only service. The views expressed are for information purposes only. None of the content provided constitutes any form of investment advice. The comments are made available purely for educational and marketing purposes and do NOT constitute advice or investment recommendation (and should not be considered as such) and do not in any way constitute an invitation to acquire any financial instrument or product. TIOmarkets and its affiliates and consultants are not liable for any damages that may be caused by individual comments or statements by TIOmarkets analysis and assumes no liability with respect to the completeness and correctness of the content presented. The investor is solely responsible for the risk of his/her investment decisions. The analyses and comments presented do not include any consideration of your personal investment objectives, financial circumstances, or needs. The content has not been prepared in accordance with any legal requirements for financial analysis and must, therefore, be viewed by the reader as marketing information. TIOmarkets prohibits duplication or publication without explicit approval.
Join us on social media

Behind every blog post lies the combined experience of the people working at TIOmarkets. We are a team of dedicated industry professionals and financial markets enthusiasts committed to providing you with trading education and financial markets commentary. Our goal is to help empower you with the knowledge you need to trade in the markets effectively.
Related Posts